Breaking down Wall Street's information edge.
A buy-side analyst on every ticker.
It reads every public company's filing the second it drops — decoded into plain English, before it's a headline. The edge every investor deserves, not just the desks.
Trade the facts, not the FOMO.
AllSight is the fastest.
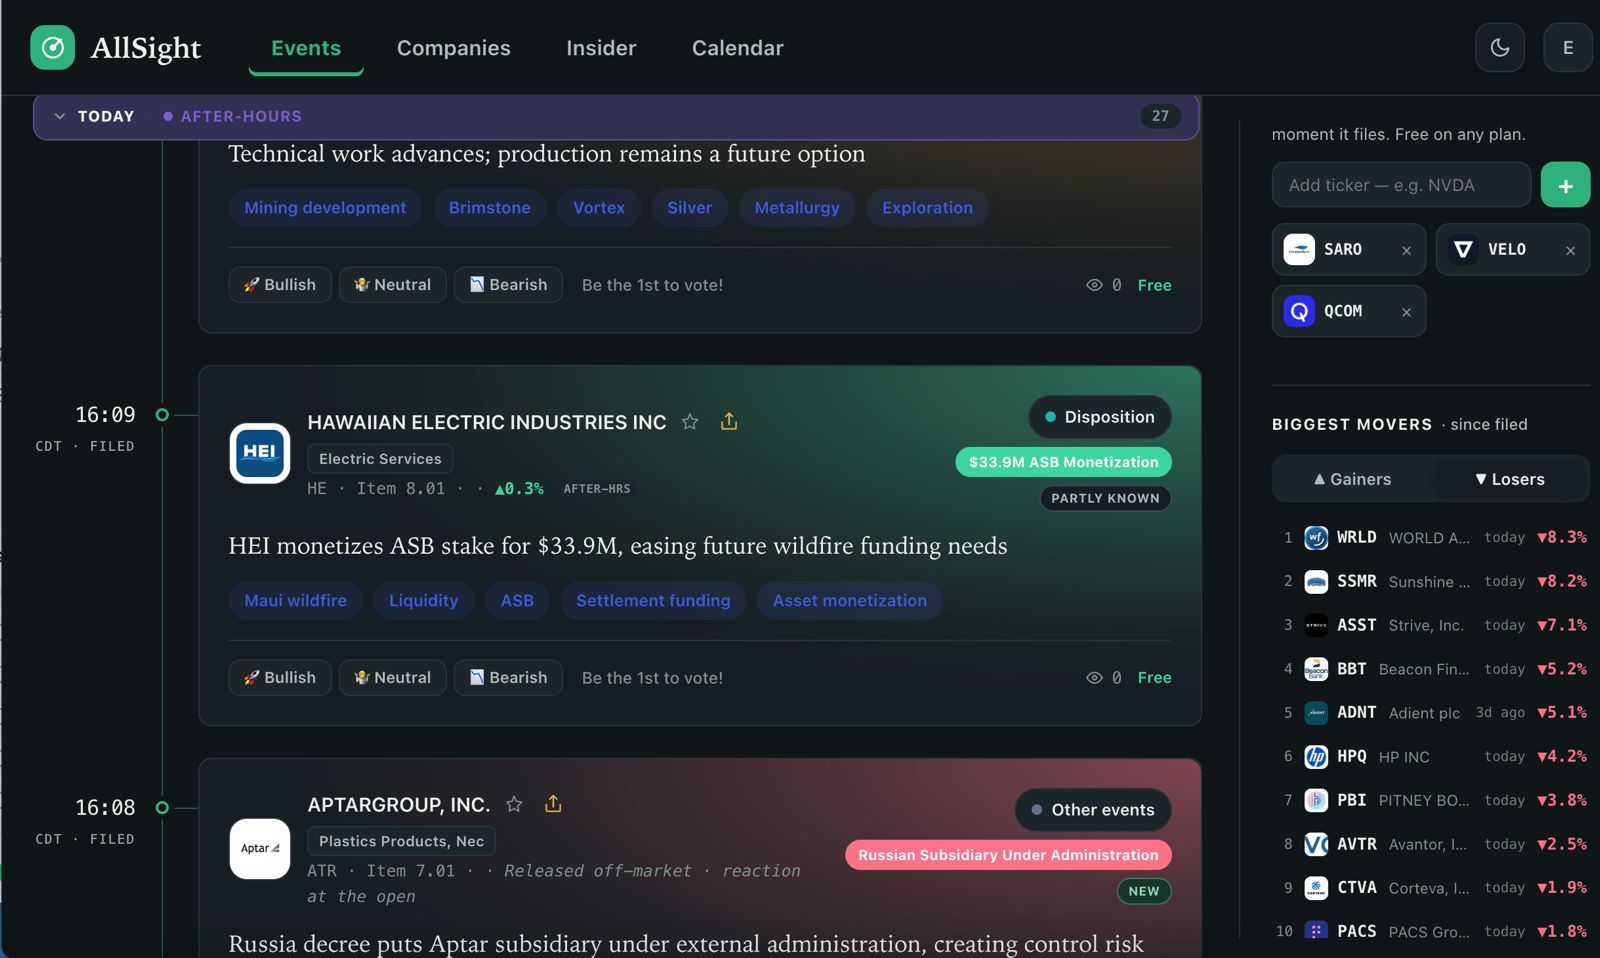
The moment it files
Every public company, around the clock. The AI never blinks and never takes lunch — nothing to set up.
Plain English — never a call.
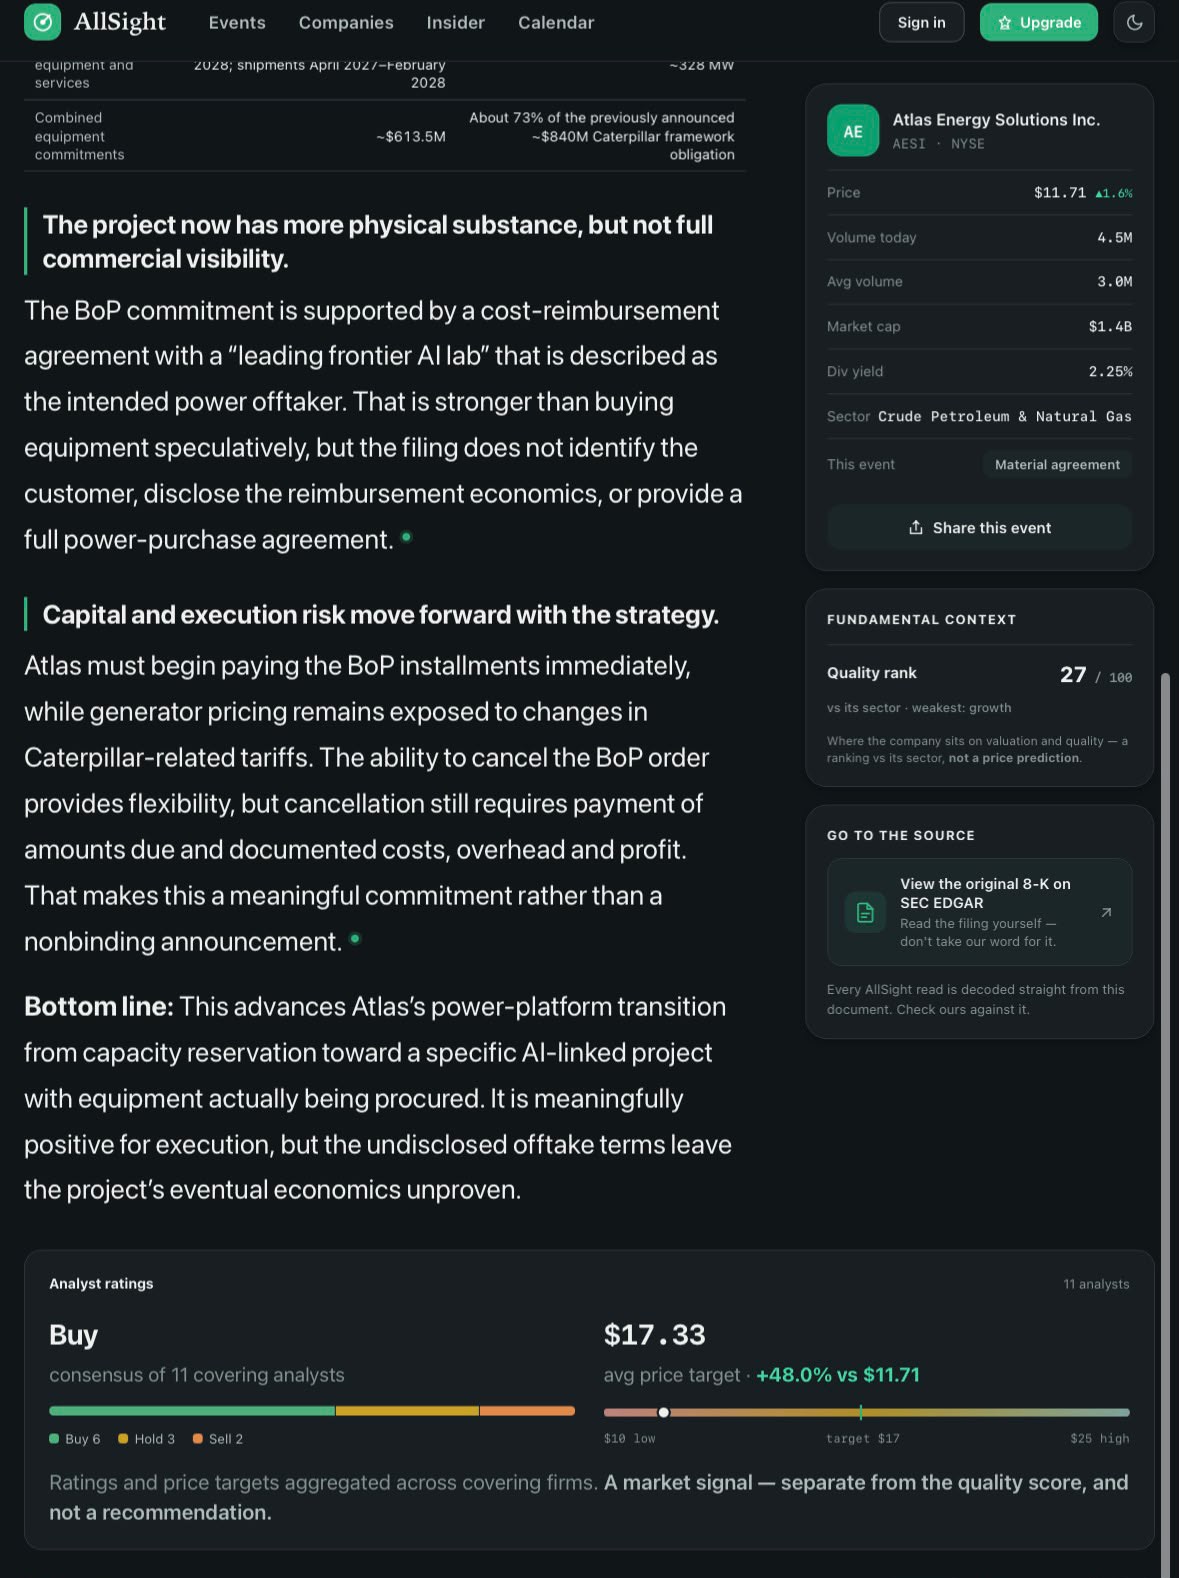
The event, the numbers, how it sits vs. expectations — in seconds. The AI decodes it; you pull the trigger.
On your screen, before the bell
Overnight and premarket, it's already read everything. You walk into every session with the setup — not scrambling to find it.
Understand it like a Wall Street analyst. Explained like a friend.
- Revenue $163.3M vs ~$144M expected; adjusted basic EPS $0.07 vs ~$0.04 consensus — a real upside surprise.Income statement
- QNX revenue +27% to $80.3M; segment EBITDA $29.0M from $20.5M. “Record performance… core automotive.”Segment — QNX
- Licensing jumped to $22.1M from $6.6M — it amplified the beat, but it's less recurring than QNX, so the quality sits in QNX.Segment — Licensing
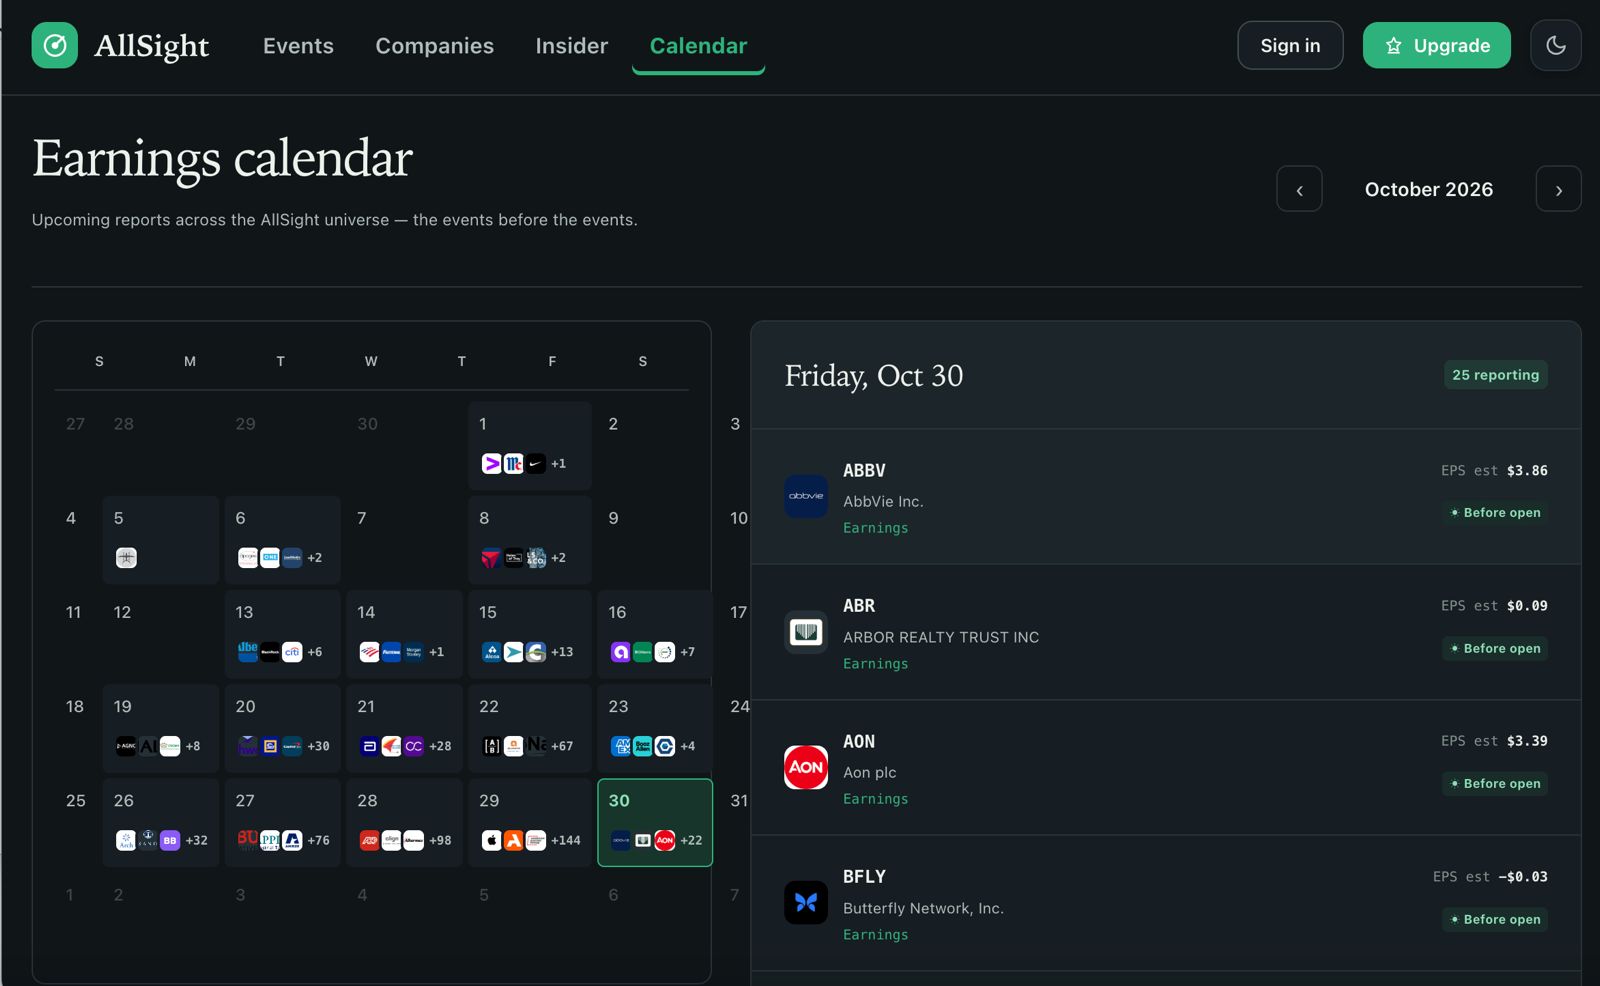
- FY27 guide lifted to $616–636M rev / $141–158M EBITDA, above the prior $594–621M / $119–139M framework.Guidance
- QNX growth, margins, cash and a raised outlook all beat. But licensing amplified it and Secure Comms is flat — net retention 91% from 93%.Segment — Secure Comms
Know a company all the way down.
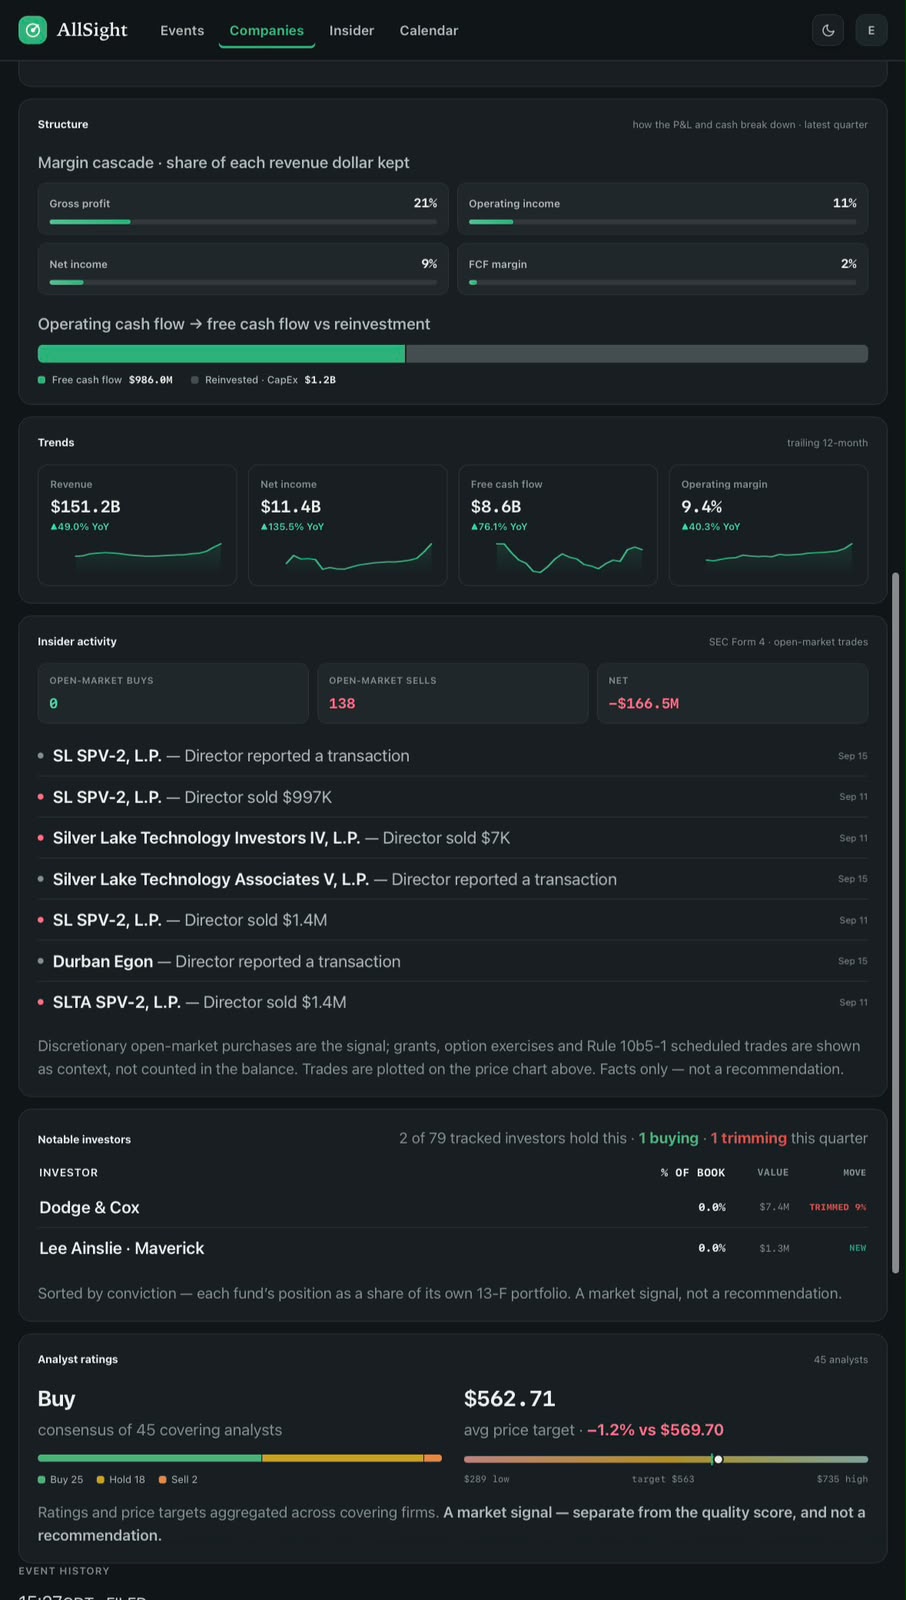
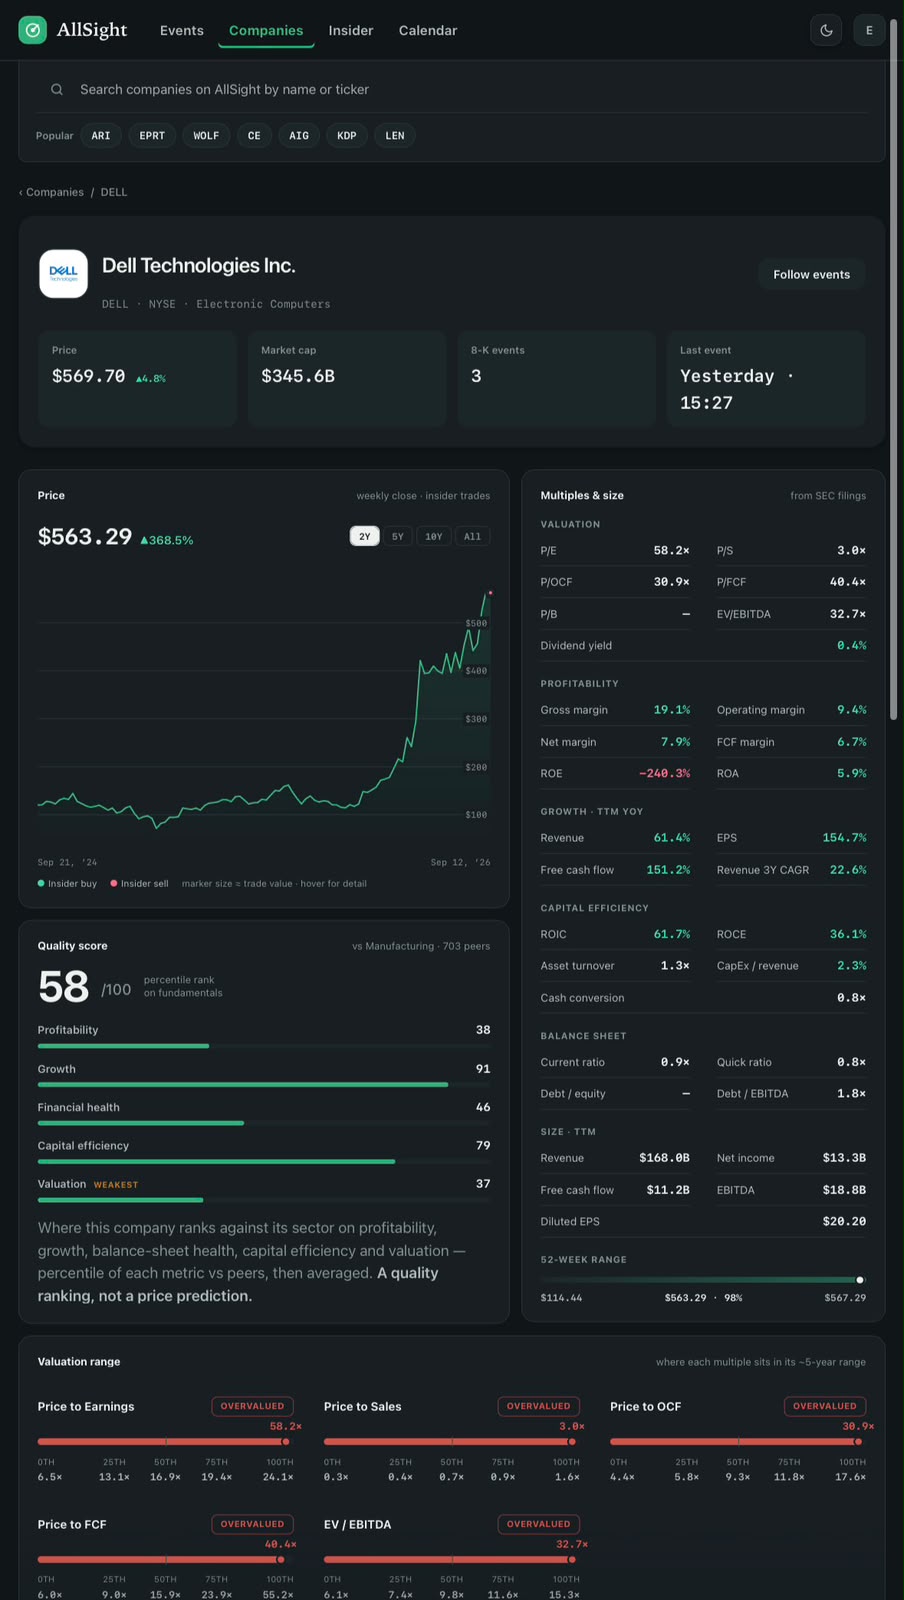
Not just one filing. AllSight profiles every public company end to end — the numbers, the quality, the insiders, the smart money, the Street. One page, nothing missed.
- Price & every insider trade, plotted
- A quality score ranked against every peer
- 40+ valuation & profitability multiples
- Where each one sits in its 5-year range
- Whole-market insider flow, in real time
- Which superinvestors are holding it
- Analyst consensus & price target
AllSight gives you an edge others can't.
One scan before the open, one after the close — every filing on every ticker, already decoded. You walk into every session fully prepared.